Introduction: Why Most App Data Doesn’t Lead to Action
Most apps today collect plenty of data—downloads, ratings, session counts, even monetization reports. But for many developers, marketers, and indie teams, all that app data leads to one of two outcomes: a cluttered dashboard or a to-do list that never gets done.
The real problem? It's not about the data. It's about the lack of insight.
App insights—or more broadly, application insights—are what turn raw numbers into action. They help you decide what’s working, what’s not, and what to do next. But here’s where it gets tricky: not all insights are useful, and not all metrics deserve your attention.
This guide breaks down five that do. We’ll go beyond surface stats and focus on:
- how visible your app really is (keyword rankings, search visibility)
- what your app download and revenue trends say about long-term traction
- what your app ratings and reviews reveal—and how to respond to them
- how user behavior analysis reveals retention issues and in-app drop-offs
- and where your monetization strategy might be quietly leaking
If you’re building an app—whether it’s a side project or something you're scaling—this is about using app analytics with intent. The goal isn’t to look at more numbers. It’s to make clearer decisions.

Insight Layer 1: App Store Keyword Rankings — What’s Blocking Your Growth
If users can’t find your app in search, they won’t download it—period. And poor visibility isn’t just a traffic issue. It’s often the first domino behind low installs, poor revenue, and wasted marketing. To fix it, you need more than isolated keyword checks—you need a system for diagnosing visibility.
What Signals to Monitor — and What They Actually Tell You
When optimizing your app’s keyword visibility, focus on these four key signals. Each reveals a different story about where your growth might be hitting a wall:
- Current Keyword Rankings
Where your app appears in search results for high-intent terms.
Interpretation: Ranking high for low-intent or irrelevant keywords means you’re visible—but not to the right users. Expect low install rates.
- Search Volume vs. Difficulty (Per Keyword)
Is your ranking truly bringing visibility, or are you buried too deep?
Interpretation: Ranking low (e.g., #25+) for high-volume terms means you’re technically “there,” but functionally invisible to most users.
- Ranking Movement (Week-over-Week)
Are your rankings climbing, flatlining, or slipping across key terms?
Interpretation: No movement across multiple keywords for 2+ weeks could signal metadata stagnation, low review scores, or a drop in algorithmic weight.
- Competitor Overlap
Which keywords are your competitors ranking for that you aren’t?
Interpretation: Competitors gaining positions on shared keywords might have refreshed metadata, added localization, or earned recent positive reviews.
You can track these signals using app store keyword tool( like ASOTools ). Remember, it’s not just the number of keywords that matters — their quality and momentum are what truly drive growth.
When to Take Action
You don’t need to react to every fluctuation—but you should act when:
- Your top 10 keywords lose visibility two weeks in a row
- You drop out of the top 10 for 3+ core keywords
- Your competitor climbs >10 positions for a term you’re flat on
- Impression counts (if tracked) drop more than 20% without a change on your side
These are not vanity signals. They reflect reduced exposure in organic discovery.
What Action Looks Like
Here’s how to respond with precision:
-
Run a Metadata Audit
– Re-check keyword inclusion in title, subtitle, and keyword field–
– Prioritize by search volume + difficulty + conversion potential–
– Refresh phrasing (e.g., swap “budget planner” for “spending tracker”) -
Re-tag and Replace Underperforming Keywords
– Use ASOTools to find high-volume, low-competition long-tails
– Track keyword trendlines, not just static volume -
Competitor Keyword Shadowing
– Identify keywords your 2–3 main competitors rank top 10
– Analyze their metadata structure and screenshot captions
– Borrow intelligently: same intent, different phrasing– -
Monitor Changes Post-Update
– After metadata updates, track ranking movement weekly for 2–3 weeks
– Expect a 7–14 day delay before impact shows on most stores
Treat them like you would ad spend efficiency: watch closely, interpret wisely, and optimize regularly. Real app insights come from understanding why you're not ranking—and doing something about it before the problem compounds.

Insight Layer 2: App Downloads & Revenue — Trends, Gaps, and Signals
Tracking app downloads and revenue is easy. Turning those numbers into clear, actionable growth decisions is not. These two metrics are often misunderstood—yet they hold the earliest and clearest signals about where your app is heading, and what needs fixing.
To make sense of them, don’t just watch the numbers. Analyze them like a decision tree.
Step 1: Are Your Downloads Growing Week Over Week?
- If yes, and steadily:
You’re likely gaining consistent organic visibility or running efficient paid campaigns.
Identify exactly what's working by analyzing the keywords, channels, ad sets, or markets that are driving sustained installs.
To go further, assess whether these installs are translating into active users. A growing install count means little without retention—check Day 1 and Day 7 retention by acquisition source.
- If flat or declining:
This could indicate ASO fatigue, limited creative rotation, or plateaued acquisition strategies.
Consider refreshing your metadata, testing new creatives, and re-evaluating both your keyword selection and targeting.
Also, watch for over-reliance on branded search or a single geographic market—diversifying acquisition sources is critical for long-term growth.
- If spiking or dropping sharply:
This is often the result of external triggers, such as store featuring, press coverage, major bugs, or a review crisis.
Always correlate download volatility with external events or internal product updates, and set up alerts to catch abnormal install shifts early.
Step 2: Is Revenue Keeping Pace With Downloads?
- If yes:
Your monetization strategy appears to scale well with your growing user base.
This is the right time to optimize further—run A/B tests on pricing tiers, introduce product bundles, or streamline the path from onboarding to paywall.
Also, focus on metrics like ARPU (average revenue per user), which provide a more meaningful view of growth than topline revenue alone.
- If downloads increase but revenue stays flat:
You may be acquiring users who don’t convert, or your paywall experience may not be compelling enough.
Start by reviewing your trial-to-paid conversion rate and evaluate whether users are clearly seeing value before being asked to pay.
You should also audit drop-off points between install, activation, and conversion to understand where users are exiting the funnel.
- If installs are stable but revenue declines:
This is a red flag—it may indicate churn among paying users, declining renewal rates, or reduced in-app purchases.
Break down your revenue streams across subscriptions, in-app purchases, and ad revenue to pinpoint where the drop is happening.
Additionally, use cohort analysis to identify shifts in paying user behavior. Has your monetization timing changed? Are users churning faster after making a purchase?
Step 3: How Do You Compare to Competitors?
Competitive benchmarking gives context to your data—and highlights whether you're ahead or falling behind in your category.
- If competitors are growing while you’re flat:
You might be underinvesting in acquisition or missing out on valuable keyword opportunities.
Use platforms like ASOTools to monitor their ASO changes, localization efforts, and advertising strategies. Learn from their moves and adjust your own tactics accordingly.
- If they monetize better at similar download volumes:
The gap may stem from differences in pricing strategies, trial durations, or how freemium features are structured.
Study their onboarding and monetization flows—specifically, when and how they introduce friction or gate features.
You can also run teardown reviews of top-performing competitors to compare their funnel structure with yours, helping identify where your monetization flow may be leaking or misaligned.
Final Note
Download and revenue metrics are not just performance indicators—they’re early warnings and growth levers. What matters is not just the numbers themselves, but how well you can read the story they tell.

Insight Layer 3: App Store Ratings & Reviews — What They Reveal and How to Respond
Ratings and reviews aren’t just about reputation—they’re a window into user experience, product-market fit, and app quality. If you're overlooking them or only reacting passively, you’re missing out on some of the most actionable app insights available.
What to Monitor—and What It Tells You
Here are the five core signals to track, along with what each one reveals:
-
Average Rating Trend (30/90-day window)
A declining trend often signals quality issues—bugs, crashes, UI regressions—especially after an update. If your rating drops below 4.0, your app store optimization may suffer too, as both rankings and conversion rates can take a hit. -
Volume of New Reviews (per week)
A sudden spike in reviews without a new release may indicate a service outage, a UI change users weren’t expecting, or a viral moment (positive or negative). Watch for mismatch between volume and sentiment. -
Sentiment Distribution (positive vs. negative vs. neutral)
A high review count with flat ratings usually means polarizing experience: some users love it, others are hitting pain points. This could be due to inconsistent performance across devices or unclear onboarding. -
Recurring Themes in Review Content
When the same complaint (e.g., “login not working,” “too many ads,” “can’t cancel subscription”) shows up repeatedly, even across different versions, it’s no longer just feedback—it’s a signal to act. -
Version-Specific Sentiment
If a single version sees a noticeable dip in rating or uptick in negativity, it’s a likely sign of a regression or misaligned product decision. Always cross-check review content with recent release notes.
These patterns are trackable via the App Store, Google Play Console, or ASO tools like ASOTools. What matters isn’t just the score—it’s the momentum and meaning behind it.
When to Act
Not all review patterns require immediate changes, but these cases do:
- Rating drops below 4.0 (especially for apps with paid acquisition)
- A single complaint is repeated across multiple reviews in a short timeframe
- A new version sees a rating shift of ±0.3 within the first 7 days
- You see a surge of 1-star reviews from a specific region, language, or OS version
Reviews are not just feedback—they’re ranking signals. Lower ratings can directly hurt app store visibility and conversion rates on your listing.
What Action Looks Like
Once you’ve diagnosed the issue, act quickly and visibly:
-
Triage by severity and visibility
→ Critical bugs affecting paid users should be prioritized over low-stakes feature complaints. -
Respond to selected reviews—strategically
→ Use replies to acknowledge issues, confirm fixes, or reframe misunderstanding.
→ Avoid generic copy-paste responses; personalize when it matters. -
Feed insights back into your product roadmap
→ Track frequently mentioned issues or requests and quantify them over time.
→ Label reviews by topic (e.g. UX, performance, onboarding) and assign owners internally. -
Leverage resolved issues to recover rating
→ Once fixed, proactively prompt satisfied users to leave updated ratings via in-app messaging (following platform guidelines).
Final Takeaway
App store reviews are one of the most public, persistent forms of app data. But their real power lies in what they unlock internally: better prioritization, sharper product decisions, and tighter alignment with user needs. Treat them not as a score—but as an insight engine.

Insight Layer 4: User Behavior Analysis — Retention & Drop-Off Insights
User behavior reveals more than retention numbers—it highlights where users get stuck, what keeps them engaged, and where product value breaks down. It turns usage into real insight.
What Signals to Monitor—and What They Actually Mean
1. Day 1 / Day 7 / Day 30 Retention
The baseline for understanding whether your app delivers lasting value.
- Low Day 1 → Users never found a reason to come back. Onboarding may be too long, confusing, or irrelevant.
- Sharp drop between Day 1 and Day 7 → Users tried it, didn’t see enough value, or hit friction.
- Flat Day 30 → A sign of long-term value—but only if your active users are the right ones.
2. Session Frequency & Length
How often and how long do users engage?
- Short, infrequent sessions → Either the core loop isn’t sticky, or the use case is too niche.
- Long but rare sessions → Possible utility use case (e.g. scanning, tax prep)—optimize for goal completion, not daily use.
- Frequent but short sessions → Could signal habitual engagement (good), or shallow usage (bad). Look deeper.
3. Funnel Completion Rates (e.g. Sign-up → Activation → Conversion)
Where users stall tells you where the product isn’t meeting expectations.
- High drop-off after install but before registration → Poor first impression or unclear value proposition.
-
Drop-off after trying a feature → Expectations set by your ASO or ads may not match in-product experience.
Use event-based analytics to identify “dead-end” screens or broken loops.
4. Feature Adoption & Pathways
Which features do users find and actually use?
- Low adoption of core features → Either users can’t find them, or they don’t think they’re useful.
- Heavy usage of one secondary feature → Possibly your real value prop is different from what you thought.
5. Uninstalls by Day
Sudden uninstall spikes often correlate with in-app friction, bugs, or aggressive monetization.
→ Cross-check with review sentiment, crash logs, and paywall entry points.
When to Take Action
You don’t need perfect metrics to start improving—but watch for:
- Day 1 retention consistently below 25% for consumer apps, or 40% for utility tools
- 30%+ drop-offs between onboarding steps
- Core feature usage below 30% of DAUs
- Repeated churn at the same stage or trigger point
- Negative reviews that match internal usage data (e.g. “can’t find X,” “confusing layout”)
What Action Looks Like
1. Prioritize retention over reach
If new users churn immediately, scaling will just amplify the leak. Fix core loops before increasing traffic.
2. Optimize for "time to value"
Measure how long it takes users to reach their first successful outcome. Cut dead steps, clarify CTAs, and front-load useful features.
3. Rebuild onboarding around real usage data
Map actual user paths—not just your ideal flow. If users are skipping steps, question whether they’re needed.
4. Use triggered messaging to catch drop-offs
Set up in-app nudges or emails tied to behavior (e.g. “You left off here—pick up where you stopped”) to re-engage cold users.
5. Run session replays or UX audits
If the data shows a problem but you can’t see why—watch real usage. Tools like UXCam, Hotjar, or Firebase’s debug tools can help.
Final Takeaway
Downloads don’t build traction—usage does. Real growth happens when users come back, complete tasks, and find enough value to stay. If you don’t know where they drop off, you’re not in control of your product experience.

Insight Layer 5: Monetization Leaks — Where You’re Losing Revenue
App revenue doesn’t always reflect how well your monetization strategy is working. In many cases, a steady stream of income hides deeper issues—users churning before converting, pricing that limits upgrades, or paywalls that block value instead of unlocking it.
To gain real app insight into monetization performance, you need to stop tracking totals—and start comparing strategies.
Strategy A vs. Strategy B: How You Charge Shapes Who Pays
Free + Paywall vs. Freemium
- Paywall-on-entry (e.g., users hit a login or feature block immediately) often creates short sessions, low Day 1 retention, and high uninstall rates.
- Freemium models (e.g., offer limited but useful core features for free) tend to extend user engagement—but may delay monetization.
Ask: Are users paying because they see value—or because they’re blocked?
Flat Pricing vs. Tiered or Dynamic
- Flat rates are simple, but often underserve power users and scare off light users.
- Tiered plans allow more price flexibility—and signal value across use cases.
Ask: Do your pricing tiers match user behavior segments?
Subscription vs. One-Time Purchase
- One-time pricing gives instant cash flow but caps LTV.
- Subscriptions create ongoing value—but only if renewals and churn are monitored closely.
Ask: Is your subscription structure driving retention—or drop-off after the first billing cycle?
Identify Monetization Leaks
Most apps don’t suffer from a lack of revenue—they suffer from missed revenue. Use these signals to find where money is leaking:
- High trial activation, low conversion → Users try it but don’t see enough value to pay.
- High conversion, low retention → Users pay once, then churn. Possibly overpromised or underdelivered.
- Low conversion despite strong usage → Your value is real, but pricing or timing is off.
- Strong installs, weak revenue per user (ARPU) → You’re acquiring the wrong users—or monetizing too late.
Tools like RevenueCat, Mixpanel, or ASOTools can help connect in-app events with payment behavior to isolate weak points.
What Action Looks Like
1. Redesign Your Paywall Based on Behavior, Not Hunches
Use event-based analytics to time your paywall after the first success moment (e.g., first edit saved, first scan complete). Show value before asking for money.
2. A/B Test Trial Length, Pricing, and Feature Locks
A 7-day trial might convert better than 3. Locking features too early can kill trust—too late, and they never upgrade.
3. Segment by Intent: Who’s Ready to Pay vs. Just Exploring
Retarget low-intent users with educational flows or free credits. Focus monetization on high-intent segments where value is already clear.
4. Track Revenue by Channel
Compare ARPU and churn from organic users vs. paid vs. referral. Some channels bring installs, others bring revenue.
5. Monitor Subscription Health, Not Just Signups
Monitor renewals, cancellations, and grace period recoveries. A growing subscriber count means little if most cancel by Month 2.
Final Takeaway
Revenue is not proof of optimization—it’s just a starting point. The real question is: Are you leaving money on the table, or building a system where value and pricing align? The best monetization strategies aren’t just profitable—they’re sustainable.

How to Build a Weekly App Insight Review Workflow
Collecting data is passive. Turning it into momentum requires routine.
Here’s how experienced teams—big or small—use a weekly rhythm to keep app insights actionable:
1. Set Insight Objectives by Stage
Different app stages need different insights.
- Launch / early traction → Focus on App Store visibility, downloads, onboarding drop-off.
- Scaling / optimization → Focus on retention patterns, monetization performance, user feedback loops.
- Plateau / churn recovery → Focus on feature usage trends, competitive benchmarks, cohort analysis.
Know what signal matters this week—and don’t chase everything at once.
2. Use a Consistent Signal Review Template
Structure your review so you’re not just “checking metrics,” but answering real questions:
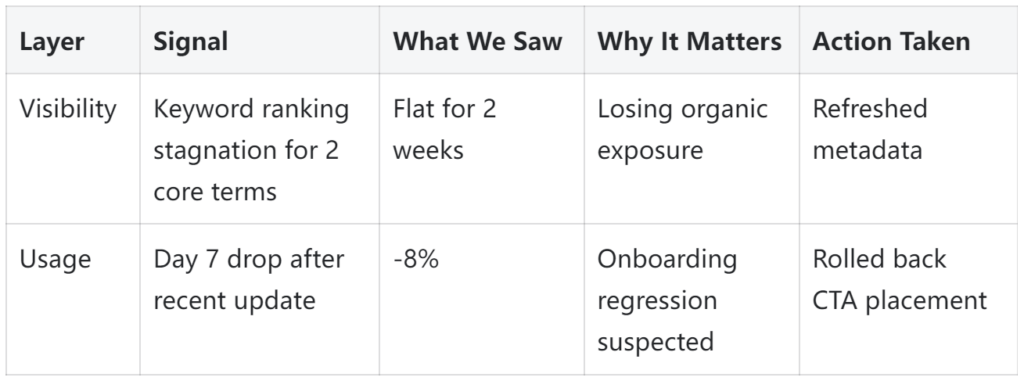
Keep it short. Keep it useful. 30 minutes a week is better than 0.
3. Assign One Insight → One Owner
App insights die in Notion docs. Make them visible, assign them, and track what changed:
- “Improve paywall opt-in rate by 20% before next sprint.”
- “Test 2 new feature titles to increase Day 1 retention by 10%.”
4. Track Lagging vs. Leading Signals Separately
- Lagging: Revenue, DAU, uninstalls. They show what’s already happened.
- Leading: Ranking movement, trial-to-paid ratio, funnel friction. They show what’s about to change.
Use leading signals to stay ahead, and lagging ones to validate direction.
Conclusion: Good App Insights Are Not “Nice to Have”—They’re a Growth Habit
There’s no shortage of app analytics, store rankings, or performance dashboards. But growth doesn’t come from dashboards—it comes from interpreting the right signals and acting fast.
The difference between a top-performing app and an average one isn’t the number of installs. It’s whether the team behind it knows why people install, stay, pay—or leave.
If you review your insights weekly, tie them to action, and optimize based on user behavior—not opinions—you won’t just grow. You’ll understand how you’re growing.
And that’s what turns data into direction.