In the saturated 4X Strategy market, stagnation is the norm. Yet, analyzing the latest Whiteout Survival revenue statistics reveals a different story. According to data from Appark Intelligence, the game recorded a historic 64.3% growth in November 2025, reaching a staggering $116.9 million.
At ASOTools, we look beyond the surface numbers. By leveraging the granular tracking provided by Appark, we can deconstruct the exact mechanics behind this surge. This wasn't just luck—it was a masterclass in feature-driven monetization by Century Games.
The Anomaly: Growth Without User Acquisition?
Typically, a revenue spike of this magnitude correlates with a massive User Acquisition (UA) campaign. However, the Whiteout Survival statistics for November tell a different story.
Key Data Points (Source: Appark):
- Monthly Revenue: Surged to $116.9M in November.
- Downloads: Remained flat at approximately 6 million.
This discrepancy highlights a critical insight: ARPU (Average Revenue Per User) Expansion. Century Games didn't buy new players; they convinced their existing high-tier players to spend significantly more. This efficiency is the "Holy Grail" of mobile game live-ops.
Geographic Statistics: A Global Cash Cow
A resilient game needs a balanced global footprint. Analyzing the Appark Regional Distribution, we see a "dual-engine" revenue model.
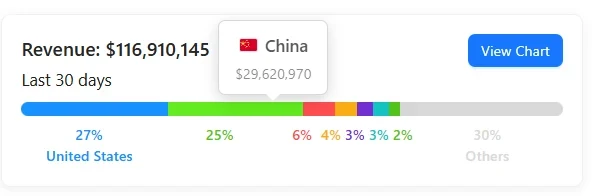
- United States (27%): The largest contributor ($31.5M), driven by seasonal Thanksgiving events.
- China (25%): Contributing $29.6M, proving that the game's localized content strategy is working effectively in its home market.
- Tier-1 Stability: Japan (6%), South Korea (4%), and Germany (3%) provide a consistent baseline of revenue.
The regional data bar clearly visualizes how these two superpowers (US & China) account for over half of the Century Games revenue stream for this title.
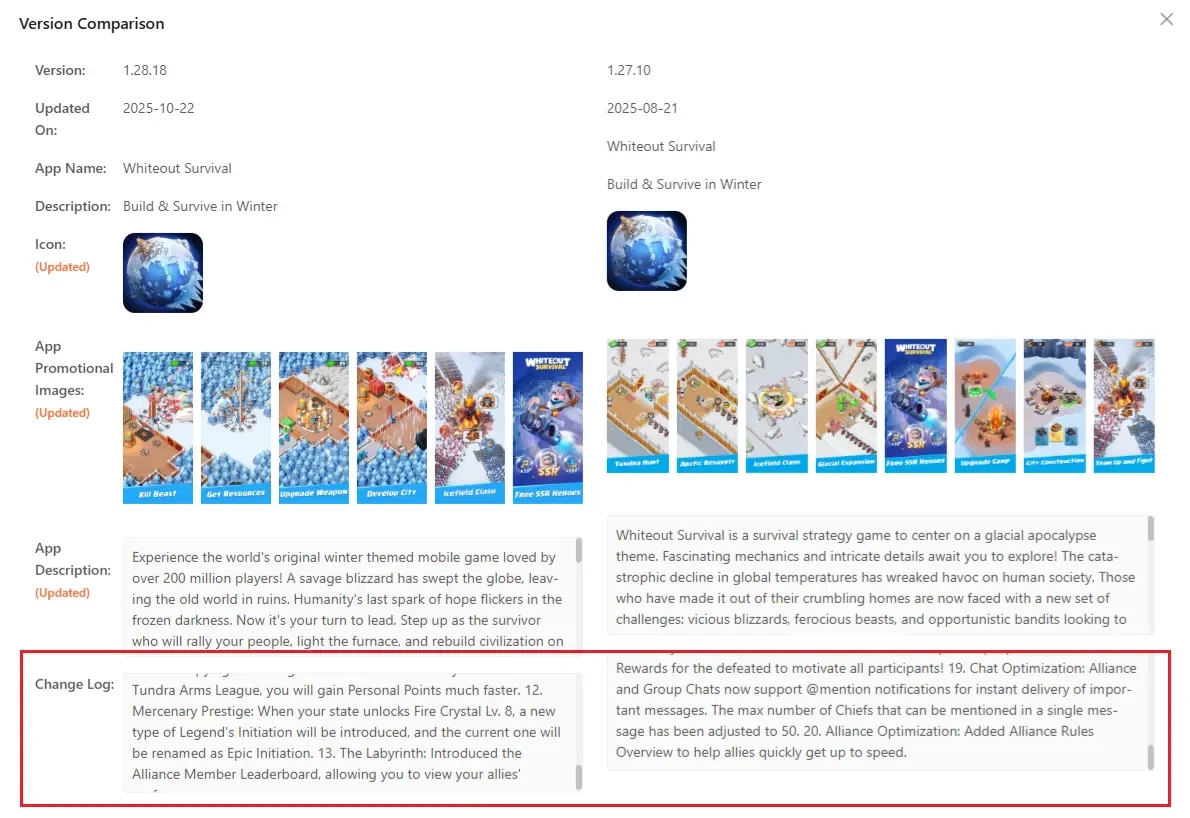
The Strategic Pivot: Version 1.28.18
How do you make players spend 60% more overnight? You change the meta.
Using the Version History logs from Appark, we pinpointed the update released on October 22 (v1.28.18) as the primary catalyst. This update introduced three key monetization levers:
-
The "Whale" Ceiling (T4 Legendary Gear):
By adding a new tier of gear (3-Star Legendary), the developers reset the power curve. Top players, who had previously "maxed out," were suddenly forced to spend again to maintain their dominance. -
Social Prestige (Leading Glory System):
This system gamified the "State Transfer" feature, offering exclusive skins to winners. It monetized social friction and alliance rivalries—one of the most effective psychological triggers in SLG gaming. -
Retention Optimization:
New QoL features like Auto-Register for Bear Hunt reduced burnout, allowing whales to focus their time (and money) on competitive events rather than repetitive chores.
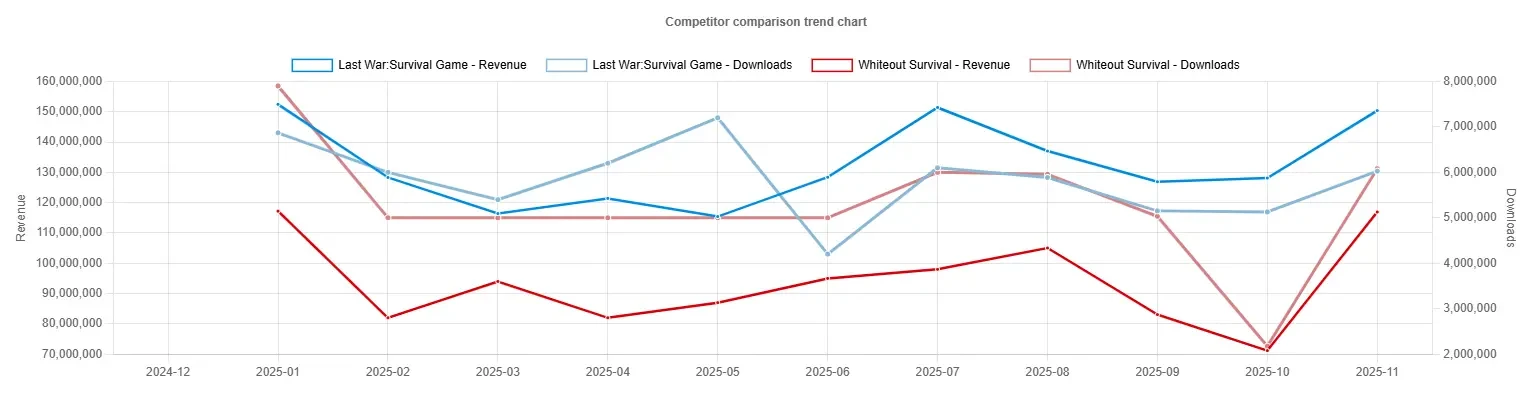
Comparative Intelligence: Whiteout Survival vs. Last War
The battle for the SLG throne is fierce. When comparing the Whiteout Survival statistics against its main rival, Last War: Survival, the trend lines diverge significantly.

While Last War maintains higher total downloads, Appark’s comparison metrics show that Whiteout Survival achieved a much sharper "Recovery Slope" in November. This indicates that Whiteout’s event loop is currently more effective at extracting value from its core user base than Last War’s.
Conclusion: The Power of Data-Driven LiveOps
The $116M peak in Whiteout Survival monthly revenue serves as a case study for the entire industry. It proves that you don't always need more users to grow; you need better features that align with player psychology.
For developers and marketers looking to replicate this success, the first step is deep competitive analysis. Understanding when your competitors update and what they change is the only way to stay ahead.
For more detailed charts, version logs, and monthly revenue estimates on Whiteout Survival, visit the full data dashboard at Appark.ai.
Frequently Asked Questions (FAQ)
Q1: Is the data presented here official?
The revenue and download estimates in this article are provided by Appark Intelligence, a third-party mobile market analytics platform.
Q2: What do the Whiteout Survival revenue statistics show for Nov 2025?
The data shows a massive spike to $116.9 million, a 64.3% increase from the previous month, driven primarily by existing user spending (ARPU) rather than new downloads.
Q3: Can I track these statistics for other games?
Yes. You can use market intelligence tools to track competitors. We recommend checking Appark’s comparison features for real-time insights into SLG market trends.
Q4: Does ASOTools offer this data?
ASOTools specializes in ASO and Keyword data. For detailed monthly revenue estimates and version analytics (like the ones cited in this article), we partner with data providers like Appark.